
Sludge Reduction
Project Background
A six (6) MGD wastewater treatment plant operated by a city in eastern United States began a product demonstration trial on March 3, 2014 to evaluate the affect of BIOLOGIC® SR2 on a range of performance parameters. The objectives of the trial were to assess the effect of the use of BIOLOGIC® SR2 on the following performance parameters:
1. Sludge reduction rates
2. Aeration energy consumption
3. Effluent quality (BOD, TSS, NH3, P)
4. Objectionable odors
Following 60 days of treatment a report was prepared documenting the results of treatment. The conclusions of the report were as follows:
Summary analysis of the results of this trial indicates that BIOLOGIC® SR2 has had and continues to have a significant, favorable effect on the plant’s performance across a range of measures. Effluent quality has stabilized and improved and plant-wide odors have been reduced. The most significant impact of BIOLOGIC® SR2 treatment is the sludge reduction achieved at the plant; sludge reduced by approximately 34%. The reduction in sludge generation has been accomplished by the micronutrients in BIOLOGIC® SR2 stimulating biological anaerobic treatment of incoming suspended solids and soluble BOD. The BIOLOGIC® SR2 product provides micronutrients that are not normally present in the sewage. The addition of the BIOLOGIC® SR2 stimulates the various strains of micro-organisms that are active in converting BOD and biosolids to carbon dioxide/methane to accelerate their activity.
The results of this treatment trial demonstrate the following impacts as a result of the use of BIOLOGIC® SR2.
• Sludge reduction achieved: 34% reduction in sludge generated.
• Aeration savings could not be quantified because current plant infrastructure does not allow for adjustments to be made to oxygen delivery rates.
• Effluent quality was improved and no plant upsets were experienced.
• Odor levels throughout the plant were changed from “high” to “low” over the course of the treatment trial and were not observed beyond the plant boundary limits
Following the presentation of the May 9, 2014 report, the decision was made to suspend treatment with BIOLOGIC® SR2 but to continue monitoring the plant operating data for an additional 60 days. The remainder of this report summarizes the plant performance results for May and June, 2014.
Plant Performance in May and June
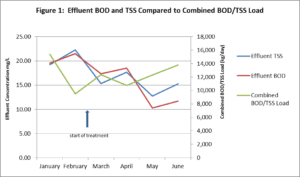
A summary of monthly averages of select plant operating data parameters from January to June 2014 shows that the plant has continued to perform well since the completion of the treatment cycle at the end of April. Effluent concentrations remain below target concentrations and there have been no significant upsets. As can be seen from Figure 1, TSS and BOD effluent concentrations have trended downward until reaching a low point in May, 2014, followed by a slight increase in June, 2014.
Sludge Reduction Rates
The primary objective of the treatment trial was to demonstrate net cost savings by achieving a reduction in the sludge wasted at the plant. Sludge generation at the plant is variable and correlates directly to the incoming organic load in the influent of the plant. The plant has been monitoring the volume of sludge wasted on a daily basis beginning in February 2014, the month before the trial began.
A useful method of assessing cost savings related to sludge wasted is to monitor the ratio of mass of sludge wasted compared to the mass of incoming organic load. The calculation for this metric is achieved by calculating the dry weight of sludge wasted and dividing it by the dry weight of BOD and/or TSS in the influent. When the dry weight is compared specifically to the dry weight of BOD in the influent, it is typically referred to as the “Biomass Yield”. For wastewater treatment plants that employ the activated sludge process, the Biomass Yield ratio ranges from 0.4 to 0.6.
The monthly average sludge wasting rates for the plant and the corresponding Biomass Yield calculations are presented in Table 1. The data shows that prior to treatment, in February, the Biomass Yield was 0.52, which is within the typical range for conventional activated sludge wastewater treatment plants. The data also shows that once treatment began in March, 2014 there was a significant decrease in monthly Biomass Yield in March and April. This trend continued into May, where the ratio appears to have bottomed out at 0.21, representing an approximate 60% decrease from the typical Biomass Yield for the plant relative to the pre-treatment data. In June, the Biomass Yield increased to 0.31.
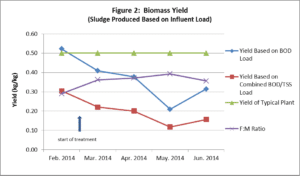
Also of note, typically it is expected that if the food to micro-organism (F:M) ratio for a wastewater treatment plant increases, the Biomass Yield ratio will also increase because more sludge will be wasted. However, during the treatment trial, the opposite was observed. The F:M ratio increased between February and May, the same period that the Biomass Yield significantly decreased. Figure 2 graphically compares monthly Biomass Yield on a BOD basis and on a combined BOD/TSS basis to the expected Biomass Yield as well as to the F:M ratio of the plant.
Based on the data, it is evident that the treatment effect from the product addition during the months of March and April was most profound on sludge generation in the month of May. The reason for this is that the microbial populations in the activated sludge continued to experience the beneficial effect of the product even though it was no longer being added to the system.
Effluent Concentrations
The effluent concentrations of key parameters show significant improvement since the start of treatment in March up until the month of May. June effluent concentrations, while still relatively low, have shown a small increase. It is also noted that for each of the 14 months that the plant was operated prior to initiating the treatment trial, at least one upset event occurred in each month where one or more effluent parameters were highlighted in the logs as being above target limits (with the exception of October 2013). Since treatment began in March 2014, there have been no upset events where effluent parameters exceeded target limits.
Discussion of Results
The data shows that the beneficial impact of the use of product was most profound during the third month (May) after treatment was initiated in the plant, despite the fact that product addition stopped at the end of April. The reduction in Biomass Yield is measured at approximately 60%. This reduction was greater than what was anticipated and represents annual net cost savings in sludge handling, processing and disposal in excess of 60%.
The beneficial impact of the product has continued for more than 30 days following treatment as a result of the micronutrients present in the product changing the makeup of the species of microorganisms in the wastewater plant. BIOLOGIC® SR2 allows specific species of microorganisms in the wastewater to more efficiently process the organic load in the wastewater and to out-compete other species that typically dominate wastewater environments. Data on the microorganism counts is available only for the month of February (the month just prior to treatment) and for March, the month immediately following beginning of treatment. The data shows a definite increase in the population of certain species and a definite decrease in the species of others. The length of time required following addition of the product for a plant to reach equilibrium in terms of dominant species of microorganisms varies from plant to plant. There is always a lag period between the start of treatment and when the plant experiences the full effect of the product. Similarly, there is a lag period between the end of treatment and when the plant returns to pre-treatment operating conditions.
Summary and Conclusions
The sludge reduction has been accomplished by the micronutrients in BIOLOGIC® SR2 stimulating biological treatment of incoming suspended solids and soluble BOD. The BIOLOGIC® SR2 product provides micronutrients that are not normally present in the wastewater.
